The Importance of Oscillators, Standard Deviation and Mean Reversion
By GCRU Gold News on Sunday, August 17 2014, 01:19 - Permalink
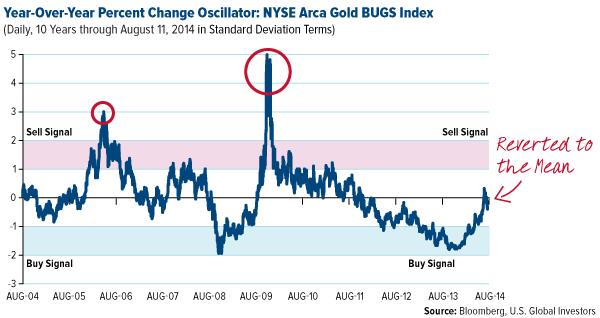
Look at the two oscillator charts below. They show the up-and-down movements in the price of gold stocks (top chart) and bullion (bottom chart) over the past ten years. One row above or below the mean, indicated by the black horizontal line, equates to one sigma; two rows above or below equates to two sigma; and so on. As you can see, mining stocks have recently reverted to their mean for the first time in about three years, while spot gold is gradually working its way back.